

BIP pro Kopf in Rumänien und der Region:
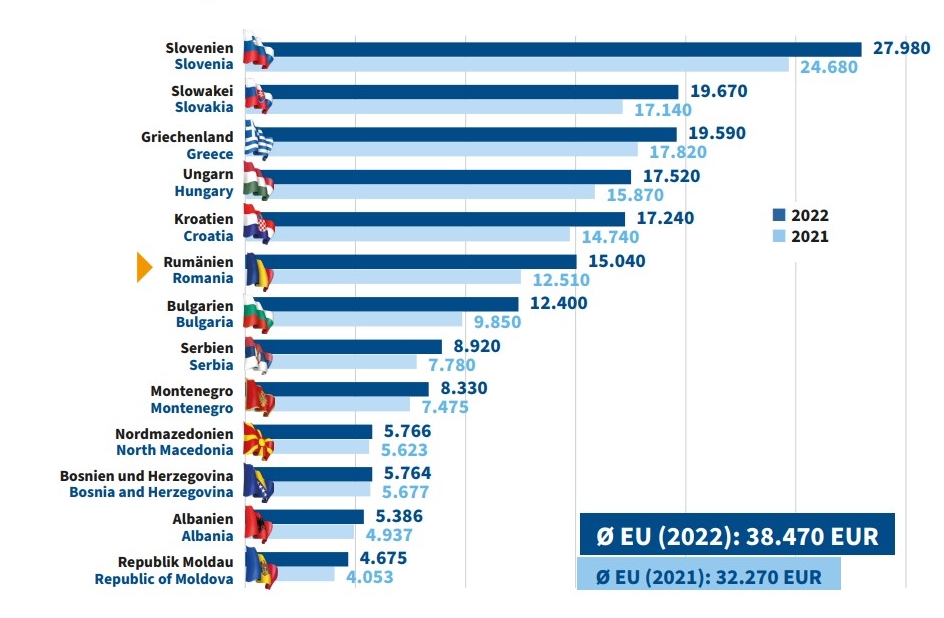
Quelle: Statista
Auslandsinvestitionen
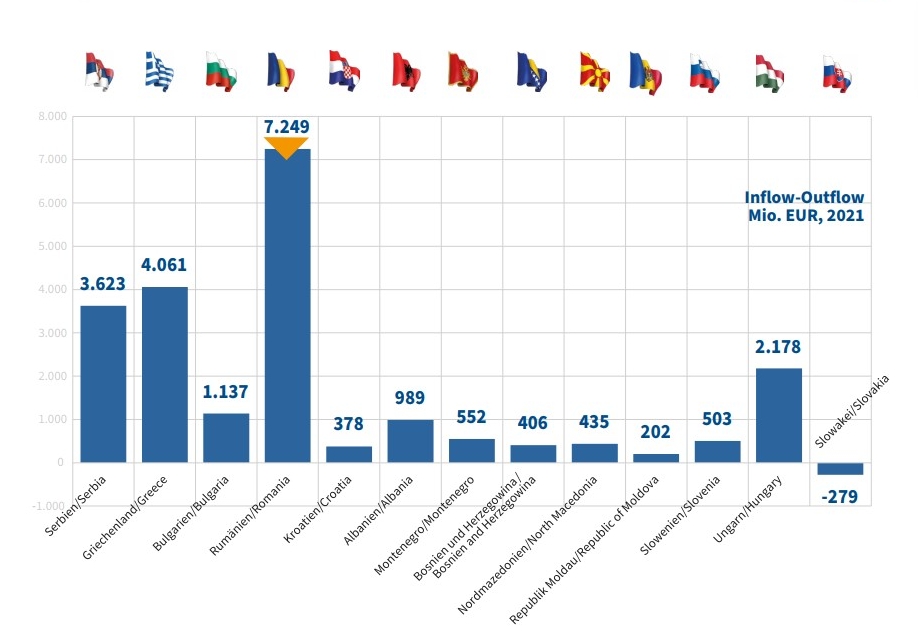
Quelle: Word Investment Report
Inflation EU-Länder 2023
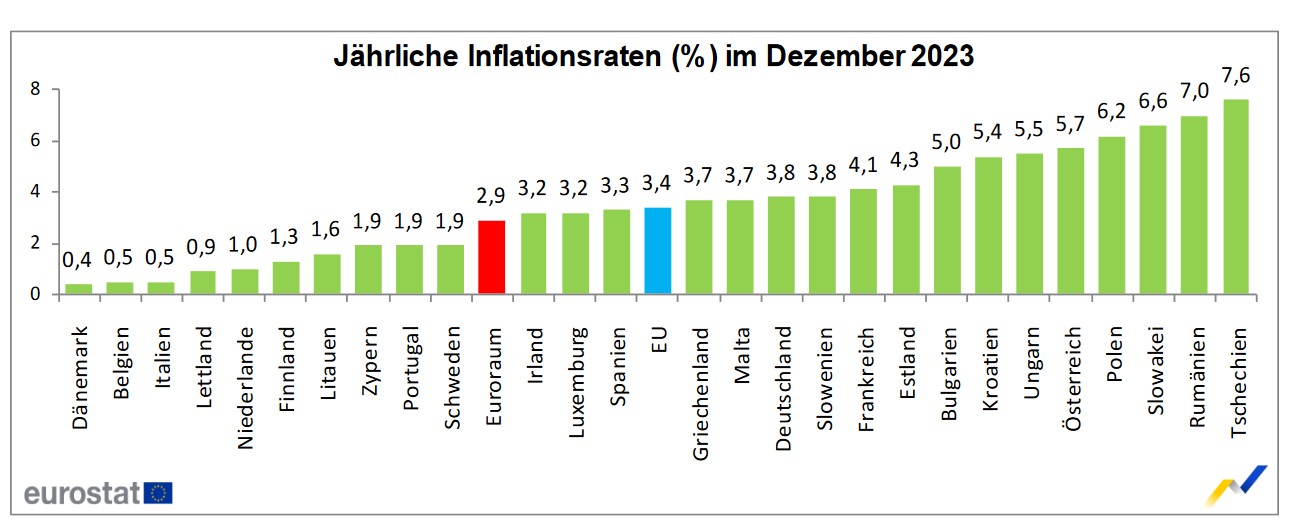 Quelle: Eurostat
Inflation Historie:
Jahr | Inflation | |
2016 | -1,5 | |
2017 | 1,3 | |
2018 | 4,6 | |
2019 | 3,8 | |
2020 | 2,6 | |
2021 | 5,1 | |
2022 | 13,8 | |
2023 | 10,4 |
Quelle: INS (Rumänisches Statistikamt)